pytorch模型网络可视化画图工具合集
在PyTorch中,有几种不同的工具可以用于网络结构的可视化。下面将以ResNet-18为例,展示如何使用常用的PyTorch画图工具进行网络结构的可视化。
ResNet-18是一个经典的卷积神经网络模型,由多个卷积层、池化层、全连接层和残差连接(Residual
Connection)组成。参考Deep
Residual Learning for Image Recognition,网络结构如下: 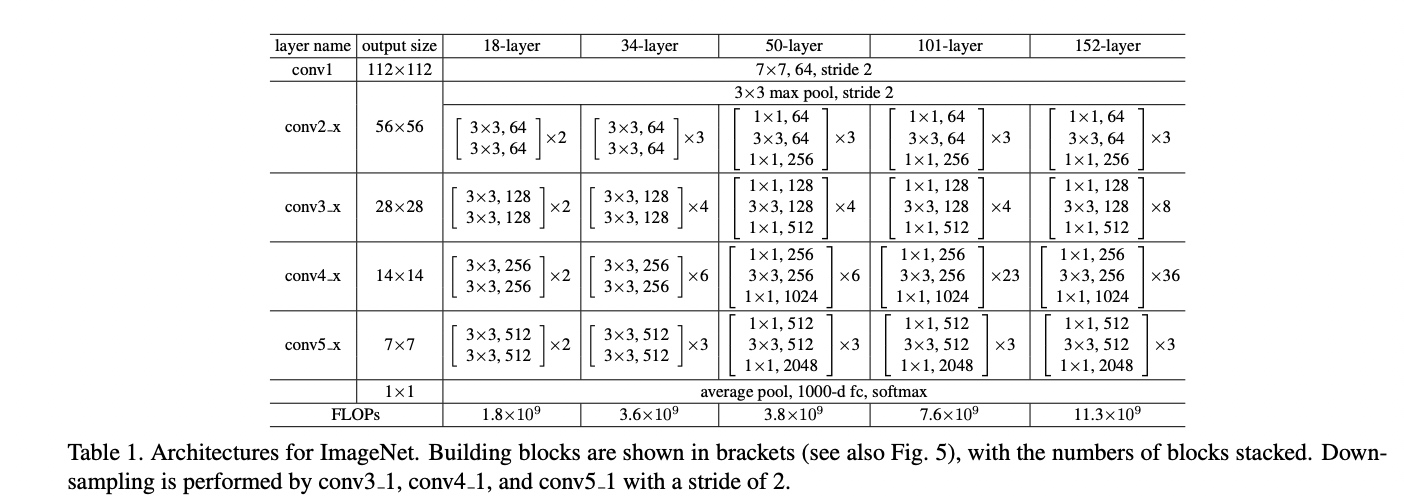
在PyTorch中可以能过torchvision快速使用ResNet-18,使用代码如下:
1 | from torchvision.models import resnet18 |
x是随机生成的输入数据,model是resnet18的实例。
1. torch print
使用torch自带的print方法。torch的model支持直接print打印,可以看到详细的网络结构。
使用示例:
1 | print(model) |
结果如下:
1 | ResNet( |
2. torchsummary
代码库:https://github.com/sksq96/pytorch-summary
使用torchsummary进行model的打印,展示的信息比print会多出来参数量和shape信息
安装:
1 | pip install torchsummary |
使用示例:
1 | from torchsummary import summary |
结果如下:
1 | ---------------------------------------------------------------- |
3. torchviz
代码库:https://github.com/szagoruyko/pytorchviz
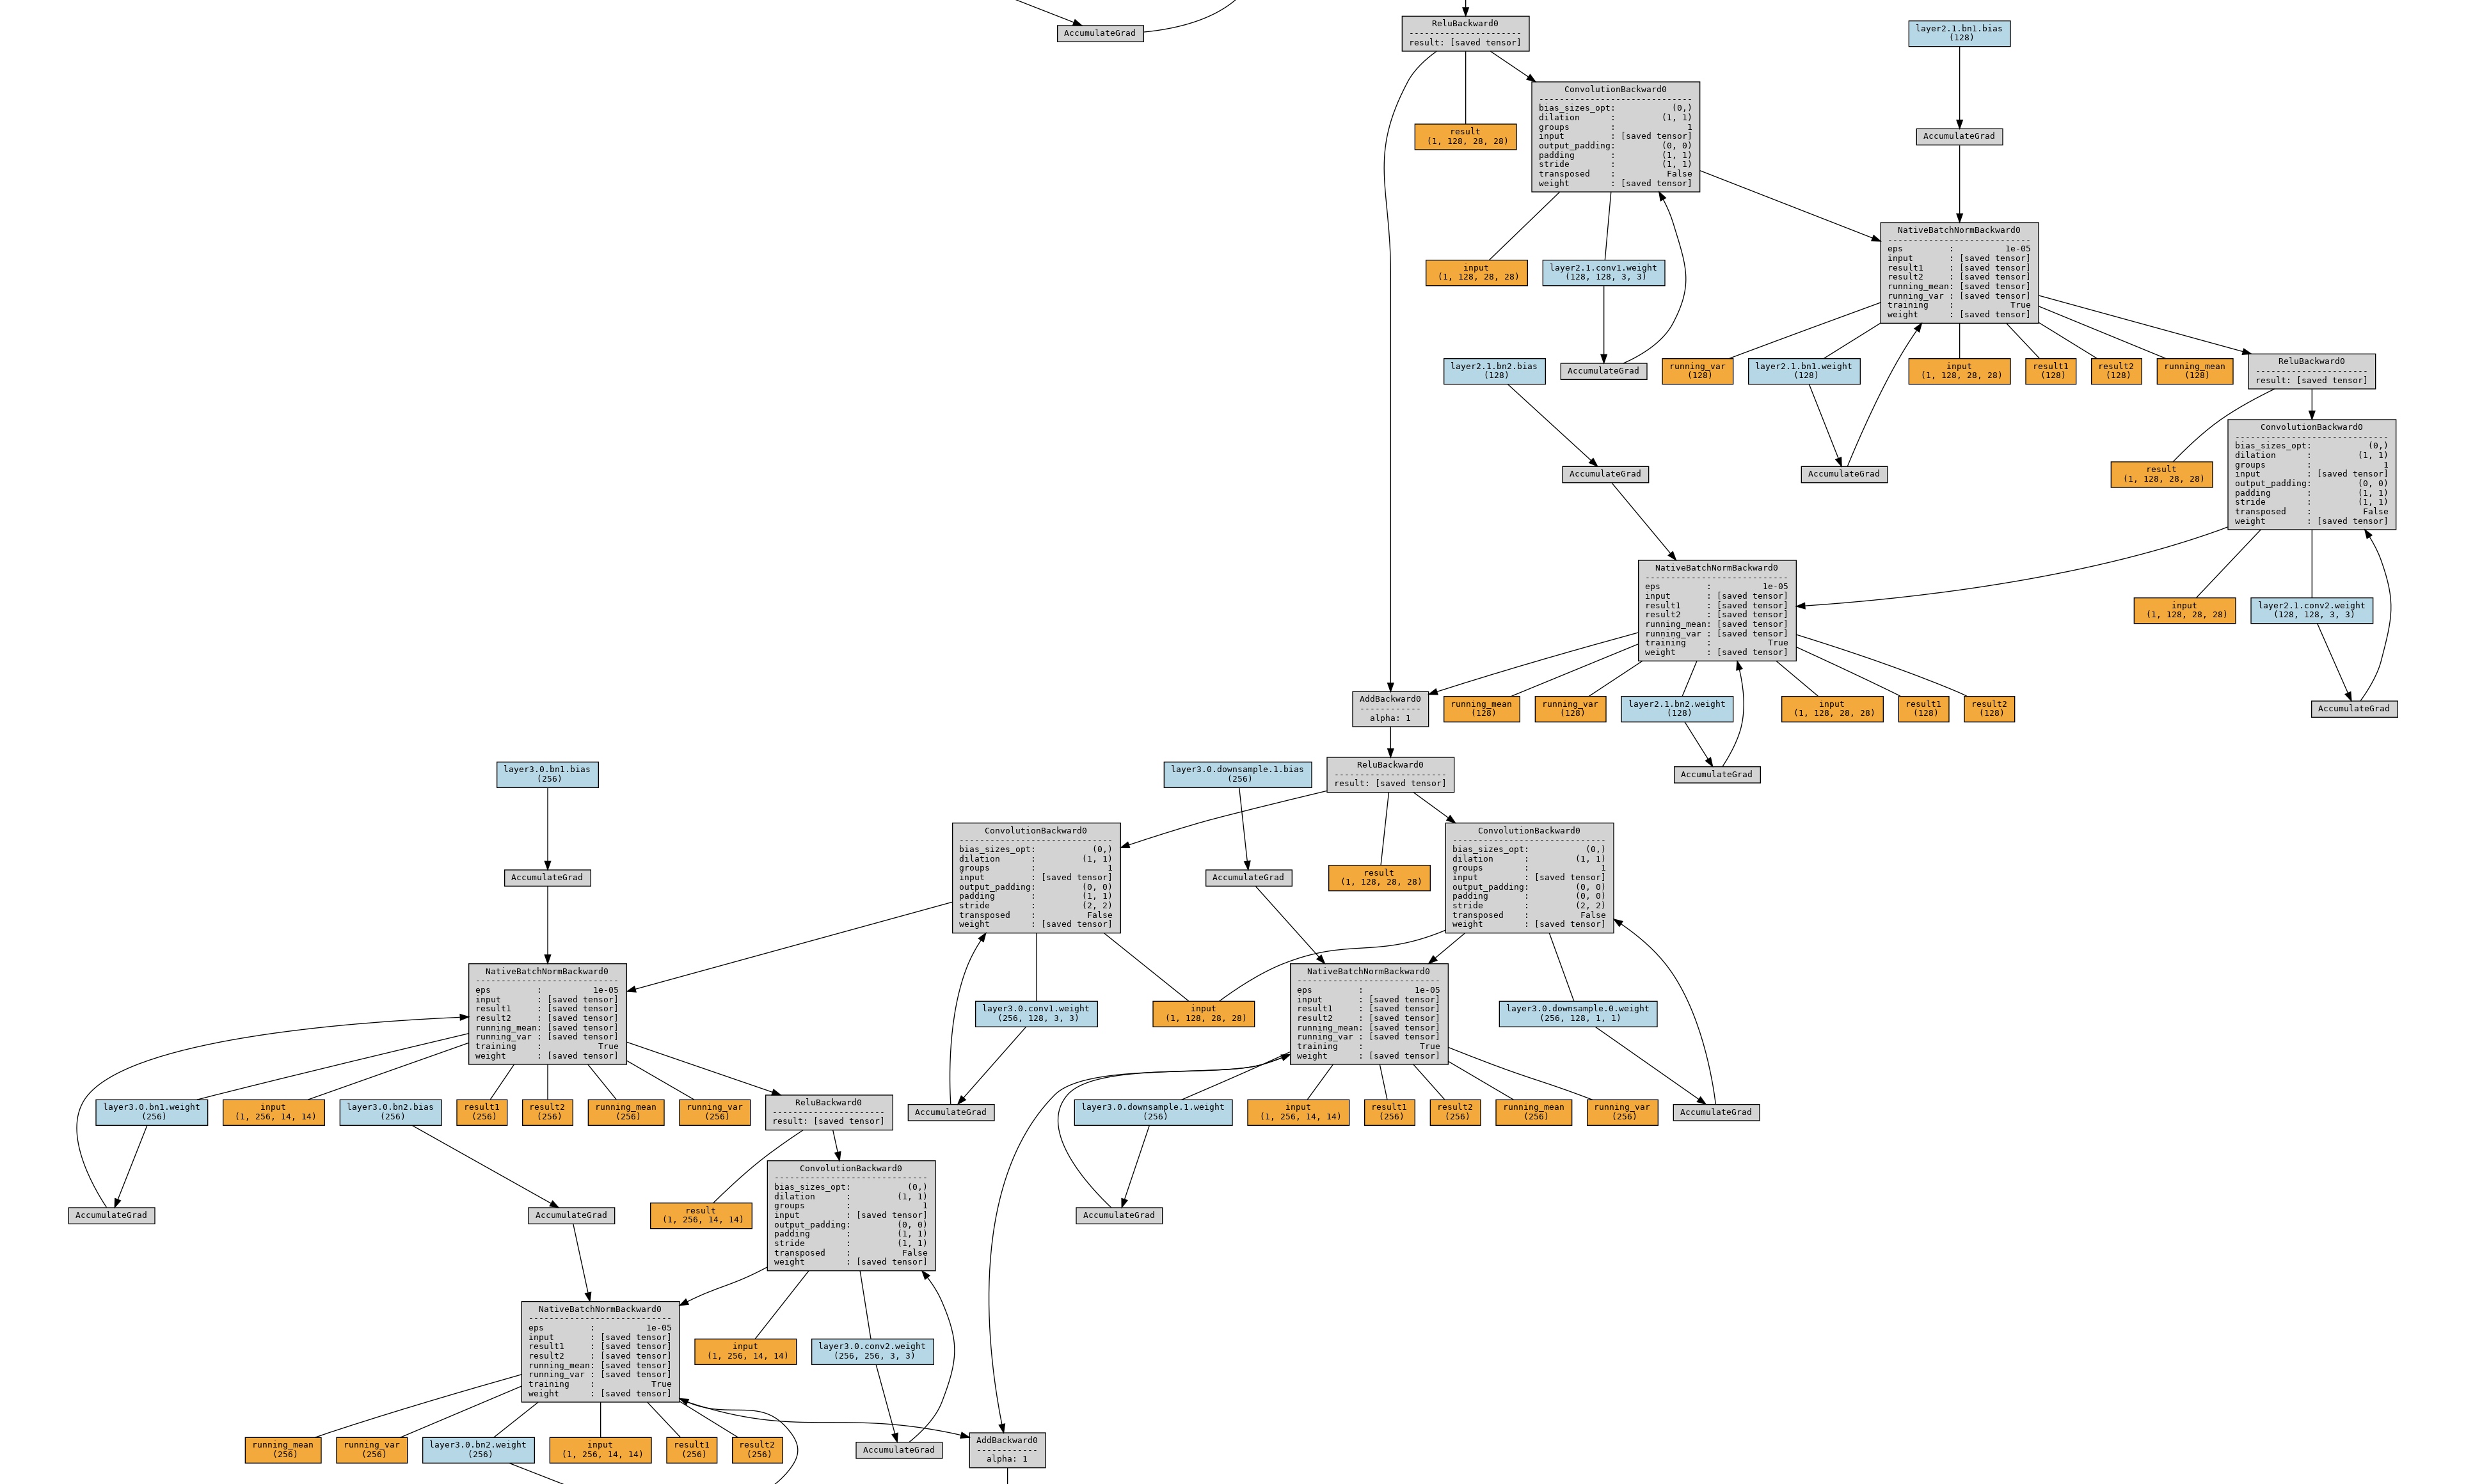
使用torchviz进行可视化(需要安装torchviz和graphviz)。torchviz会通过backward的过程对整个网络进行展示。
安装:
1 | apt install python3-pydot python3-pydot-ng graphviz xdg-utils |
使用示例,
保存图片到文件中,如果终端直接展示的话render函数中的view配置改为True:
1 | from torchviz import make_dot |
结果如下:
4. hiddenlayer
代码库:https://github.com/waleedka/hiddenlayer
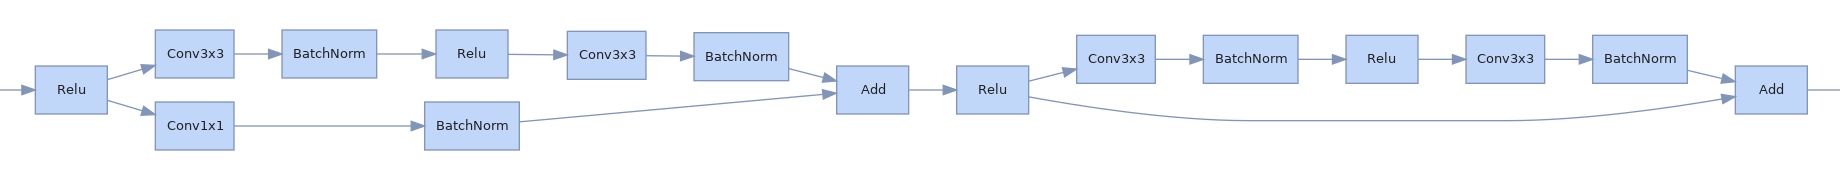
hiddenlayer跟之前比的一个特色在于,hiddenlayer中支持transforms配置,可以对指定的多个连续算子进行fusion展示,以及有多个重复的结构的话可以进行fold压缩展示。
安装:
1 | pip install matplotlib |
使用示例:
1 | import hiddenlayer as hl |
结果如下:
5. torchview
代码库:https://github.com/mert-kurttutan/torchview
安装:
1 | pip install torchview |
使用示例:
1 | from torchview import draw_graph |
结果如下: 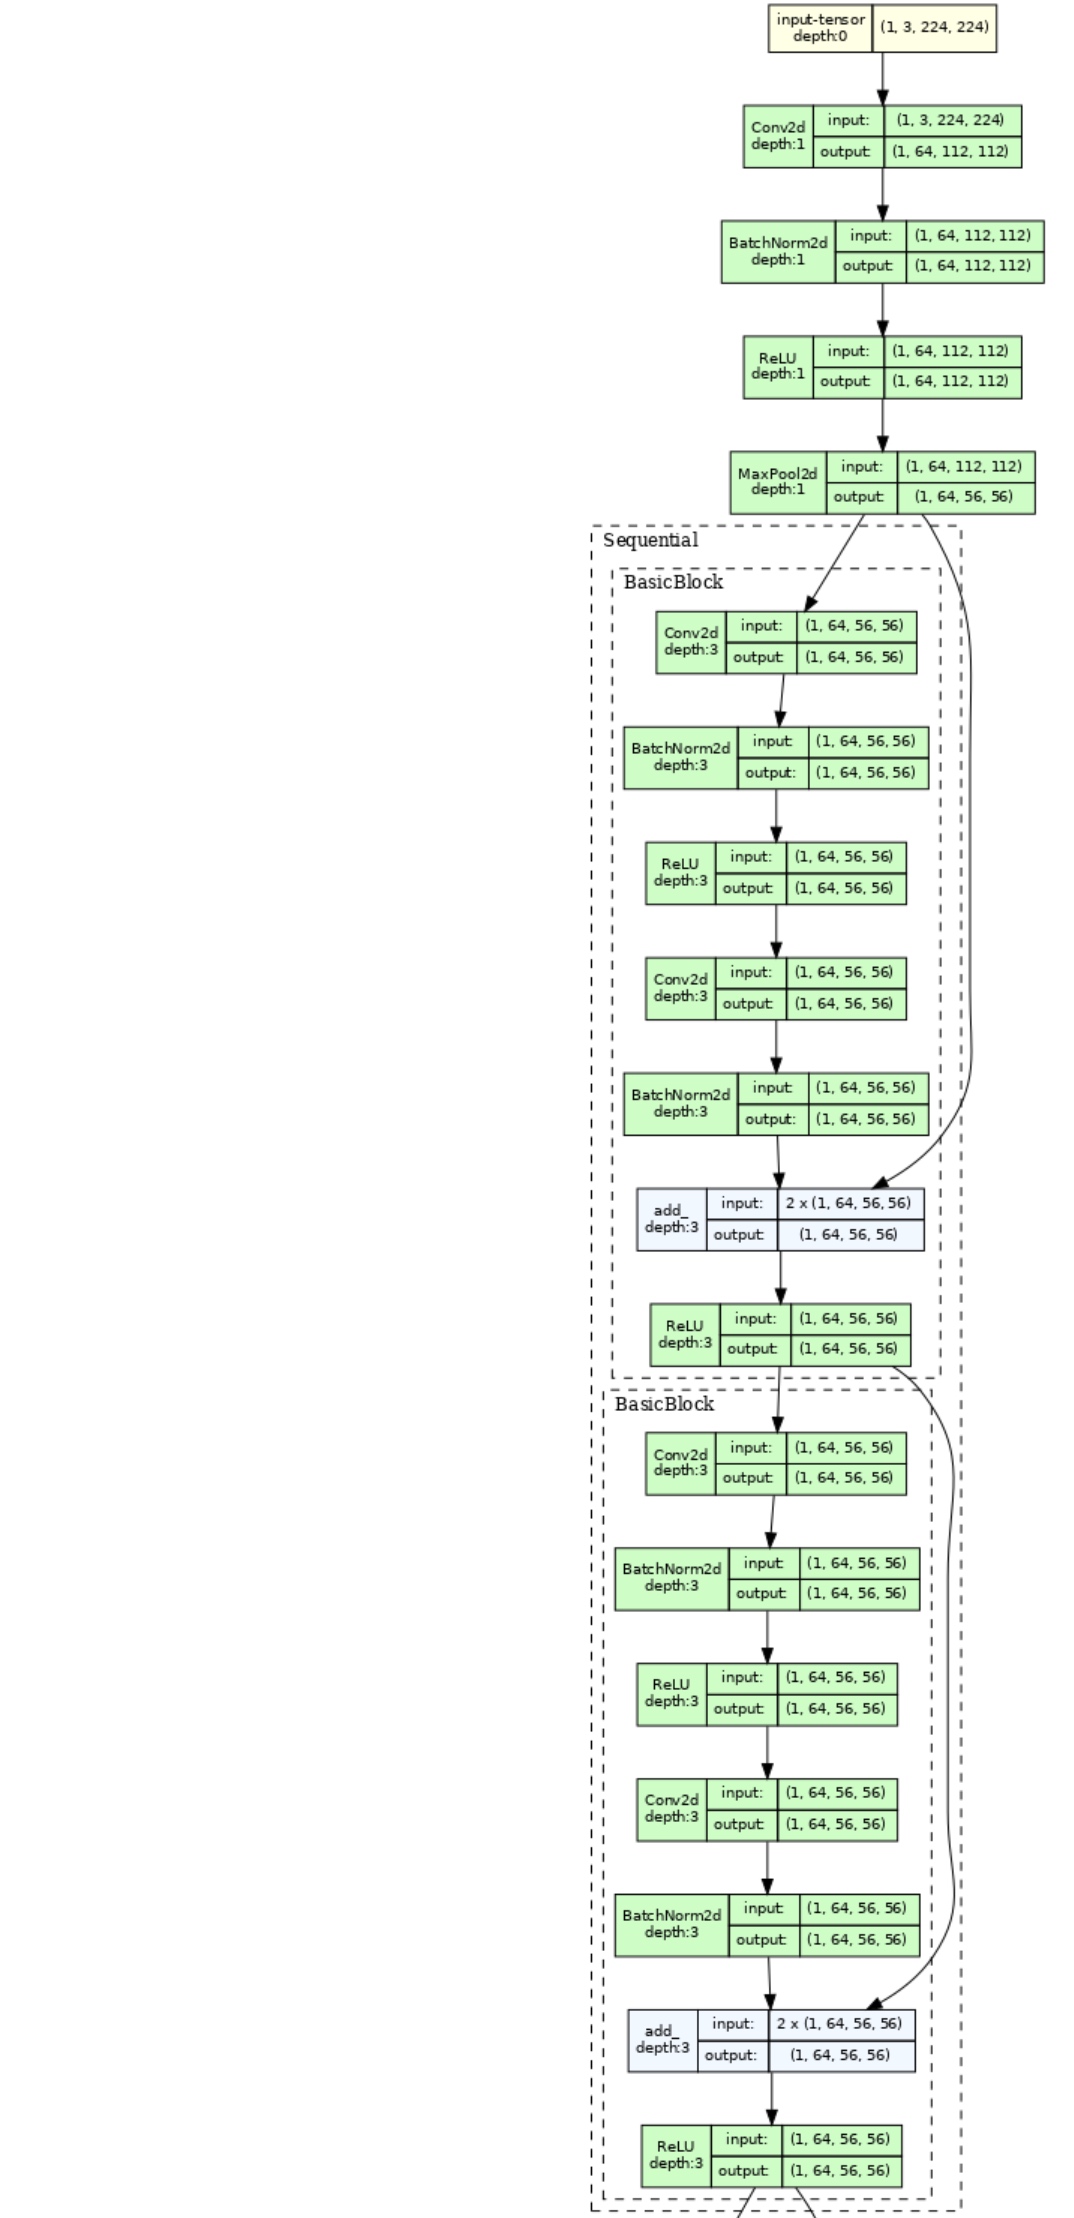
6. netron
代码库:https://github.com/lutzroeder/netron
netron可以对保存的模型文件进行可视化展示。介绍中支持的格式有:
Netron supports ONNX, TensorFlow Lite, Caffe, Keras, Darknet, PaddlePaddle, ncnn, MNN, Core ML, RKNN, MXNet, MindSpore Lite, TNN, Barracuda, Tengine, CNTK, TensorFlow.js, Caffe2 and UFF.
安装:
1 | pip install onnx |
使用示例:
1 | onnx_file_path = "resnet18.onnx" |
使用netron导入resnet18.onnx文件,结果如下: 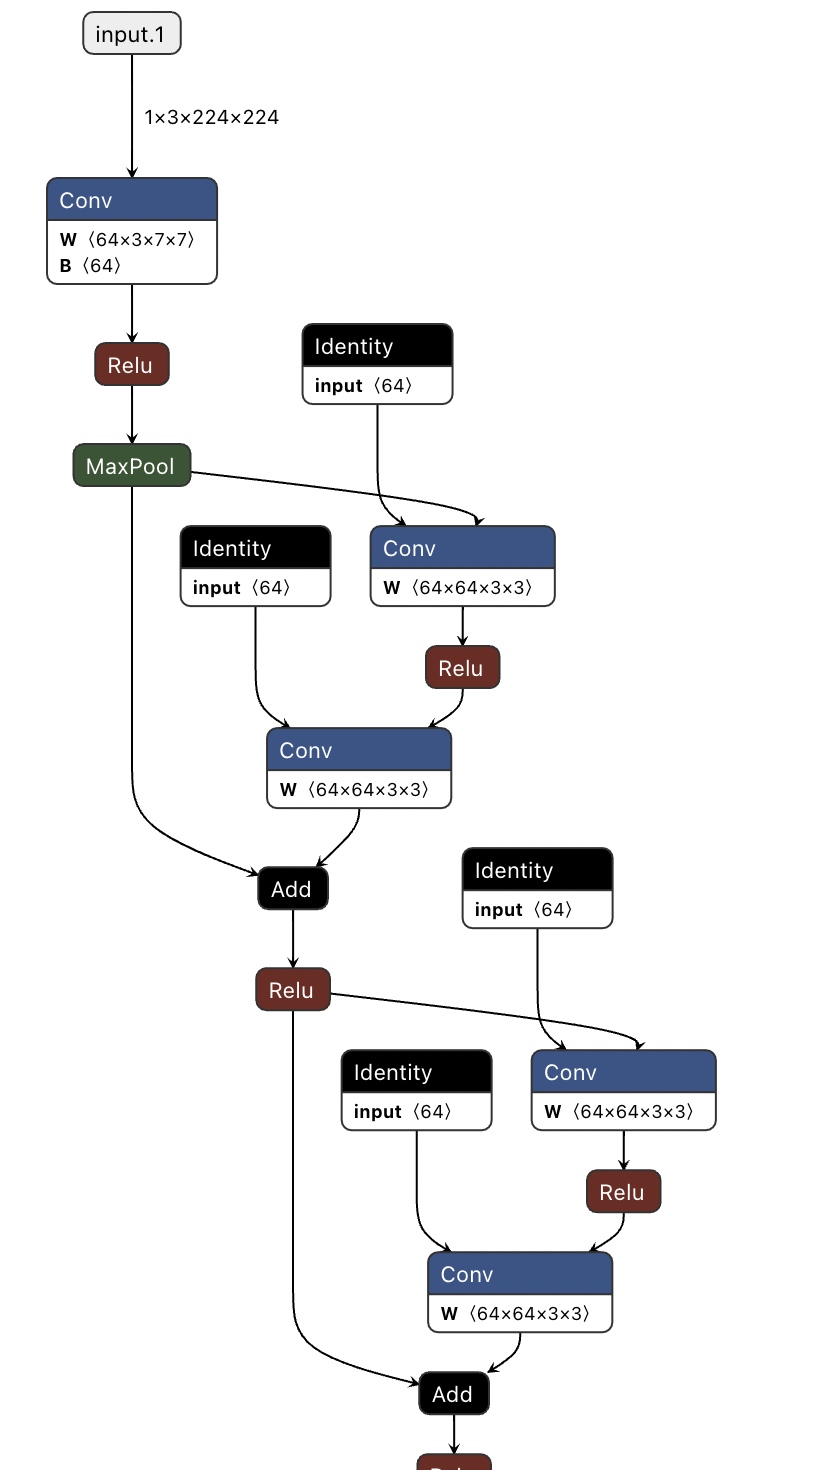
7. 完整代码
1 | #!/usr/bin/env python |